 Home
Home
Mississauga housing market overview
- The average home price in Mississauga was $1,048,914 — a 2.7% year-over-year increase.
- The median home price in Mississauga was $970,000 — a 3.19% year-over-year increase.
- The average detached home price increased 1.48% year-over-year to $1,461,044
- The semi-detached home price decreased -9.59% year-over-year to $980,808
- The condo townhouse home price decreased -1.31% year-over-year to $786,042
- The average condo apartment home price decreased -6.09% year-over-year to $612,937
Table of contents
- Average Home Price Trends
- Important Market Metrics
- Historical Home Prices
- Home Price by Property Type
Average home price trends
The average home price across all property types in Mississauga was $1,048,914. Home prices have increased 2.7% year-over-year compared to the average home price of $1,021,324 the prior year. The average home price across all property types saw a 0.42% month-over-month increased from the average home price of $1,044,543 the prior month. Here is how the average home price has changed across property types.
Read More: Toronto (GTA) Home Prices
| Property Type | Average | M/M | Y/Y |
|---|---|---|---|
| Detached | $1,461,044 | -5.97% | +1.48% |
| Semi-Detached | $980,808 | -2.36% | -9.59% |
| Condo Townhouse | $786,042 | +1.61% | -1.31% |
| Condo Apartment | $612,937 | +1.06% | -6.09% |
Important Market Metrics
Sales
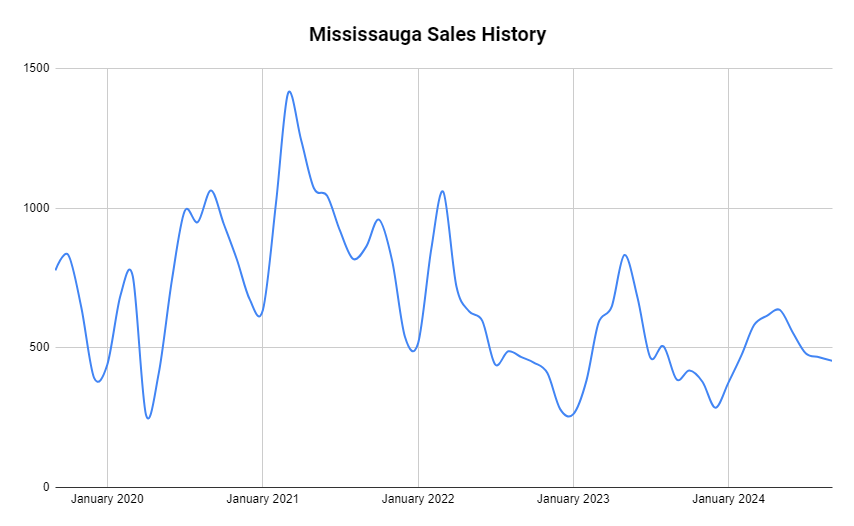
Total sales in Mississauga were 453 which is a 17.36% increase from 386 sales the prior year. Here is how the sales are broken down by property type:
- Detached: 171 — a 22.14% Y/Y increase
- Semi-Detached: 77 — a 113.89% Y/Y increase
- Condo Townhouse: 77 — a 6.94% Y/Y increase
- Condo Apartment: 102 — a -16.39% Y/Y decrease
Inventory
The housing inventory this month is 3.3 months which is up from 3.3 months of inventory the prior month and 2.2 months the prior year. Housing inventory this month is much higher than the historical 5-year average which is 0 months of inventory.
Listings
Mississauga had total new listings of 1514 which is a 4.92% Y/Y increase and 29.51% M/M increase.
Sales-to-new-Listings Ratio
The sales-to-new listing ratio is an important metric as it helps us to understand the balance of supply and demand in the housing market which helps determine who has the majority of negotiating power in the housing market. The sales-to-new-listings ratio (SNLR) in Mississauga was 40.1% in August 2024. The SNLR indicates a buyers market market with a SNLR ratio that falling below 40%.
Home prices in Mississauga
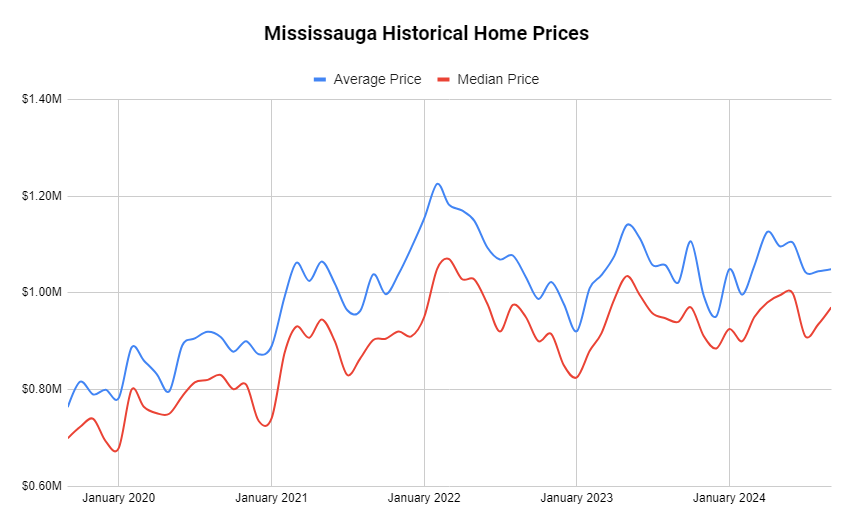
All property types
The highest historical average home price in Mississauga was $1,070,000.
| Stat | August 2024 | Y/Y Change |
|---|---|---|
| Average Price | $1,048,914 | +2.7% |
| Median Price | $970,000 | +3.19% |
| Sales | 453 | +17.36% |
| New Listings | 1514 | +4.92% |
| Active Listings | 2199 | +28.75% |
Single-family detached home prices in Mississauga
| Stat | August 2024 | Y/Y Change |
|---|---|---|
| Average Price | $1,461,044 | +1.48% |
| Median Price | $1,338,001 | +0.79% |
| Sales | 171 | +22.14% |
| New Listings | 604 | +11.85% |
| Active Listings | 830 | +32.38% |
Semi-detached home prices in Mississauga
| Stat | August 2024 | Y/Y Change |
|---|---|---|
| Average Price | $980,808 | -9.59% |
| Median Price | $970,000 | -9.39% |
| Sales | 77 | +113.89% |
| New Listings | 148 | +12.12% |
| Active Listings | 172 | +20.28% |
Condo townhouse prices in Mississauga
| Stat | August 2024 | Y/Y Change |
|---|---|---|
| Average Price | $786,042 | -1.31% |
| Median Price | $770,000 | -4.35% |
| Sales | 77 | +6.94% |
| New Listings | 241 | -3.6% |
| Active Listings | 352 | +22.65% |
Condo apartment prices in Mississauga
| Stat | August 2024 | Y/Y Change |
|---|---|---|
| Average Price | $612,937 | -6.09% |
| Median Price | $557,000 | -8.84% |
| Sales | 102 | -16.39% |
| New Listings | 458 | -1.72% |
| Active Listings | 763 | +27.81% |
- Canada housing market report
- Calgary housing market report
- Edmonton housing market report
- Hamilton housing market report
- Ontario housing market report
- Ottawa housing market report
- Toronto housing market report
- Vancouver housing market report
- Waterloo housing market report
source: TBREB; CREA