Markham housing market overview
- The average home price in Markham was $1,281,912 — a -5.08% year-over-year decrease.
- The median home price in Markham was $1,210,000 — a -6.48% year-over-year decrease.
- The average detached home price decreased -6.83% year-over-year to $1,714,983
- The semi-detached home price decreased -3.29% year-over-year to $1,226,500
- The condo townhouse home price increased 1.52% year-over-year to $1,229,200
- The average condo apartment home price decreased -0.24% year-over-year to $681,151
Table of contents
- Average Home Price Trends
- Important Market Metrics
- Historical Home Prices
- Home Price by Property Type
Average home price trends
The average home price across all property types in Markham was $1,281,912. Home prices have decreased -5.08% year-over-year compared to the average home price of $1,350,555 the prior year. The average home price across all property types saw a 4.41% month-over-month increased from the average home price of $1,227,789 the prior month. Here is how the average home price has changed across property types.
Read More: Toronto (GTA) Home Prices
| Property Type | Average | M/M | Y/Y |
|---|---|---|---|
| Detached | $1,714,983 | +4.8% | -6.83% |
| Semi-Detached | $1,226,500 | +0.4% | -3.29% |
| Condo Townhouse | $1,229,200 | +5.94% | +1.52% |
| Condo Apartment | $681,151 | -2% | -0.24% |
Important Market Metrics
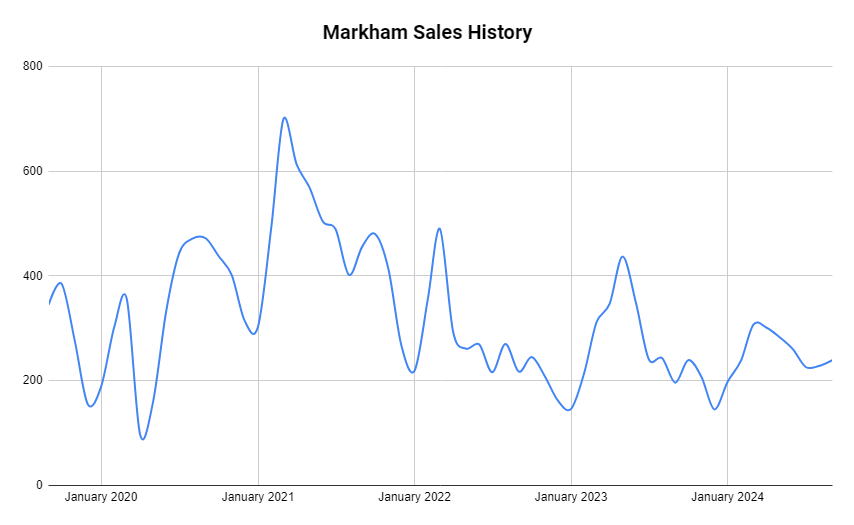
Sales
Total sales in Markham were 251 which is a 21.26% increase from 207 sales the prior year. Here is how the sales are broken down by property type:
- Detached: 106 — a 12.77% Y/Y increase
- Semi-Detached: 12 — a -7.69% Y/Y decrease
- Condo Townhouse: 51 — a 70% Y/Y increase
- Condo Apartment: 58 — a 23.4% Y/Y increase
Inventory
The housing inventory this month is 2.9 months which is up from 2.8 months of inventory the prior month and 1.8 months the prior year. Housing inventory this month is much higher than the historical 5-year average which is 0 months of inventory.
Listings
Markham had total new listings of 469 which is a 19.64% Y/Y increase and -33.19% M/M decrease.
Sales-to-new-Listings Ratio
The sales-to-new listing ratio is an important metric as it helps us to understand the balance of supply and demand in the housing market which helps determine who has the majority of negotiating power in the housing market. The sales-to-new-listings ratio (SNLR) in Markham was 44.6% in August 2024. The SNLR indicates a buyers market market with a SNLR ratio that falling below 40%.
Markham historical home prices
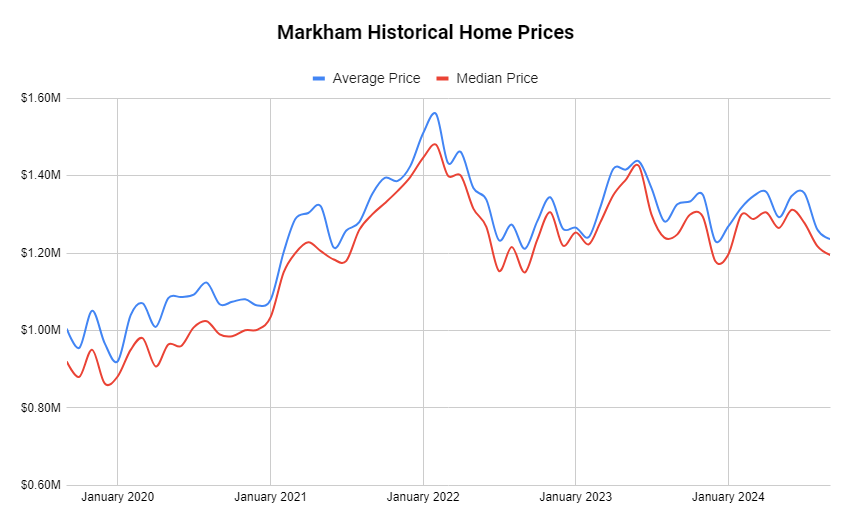
All property types
The highest historical average home price in Markham was $0. The highest historical median home price was $0.
| Stat | August 2024 | Y/Y Change |
|---|---|---|
| Average Price | $1,281,912 | -5.08% |
| Median Price | $1,210,000 | -6.48% |
| Sales | 251 | +21.26% |
| New Listings | 469 | +19.64% |
| Active Listings | 883 | +54.1% |
Single-family detached home prices in Markham
| Stat | August 2024 | Y/Y Change |
|---|---|---|
| Average Price | $1,714,983 | -6.83% |
| Median Price | $1,629,000 | +0.65% |
| Sales | 106 | +12.77% |
| New Listings | 182 | +23.81% |
| Active Listings | 357 | +57.96% |
Semi-detached home prices in Markham
| Stat | August 2024 | Y/Y Change |
|---|---|---|
| Average Price | $1,226,500 | -3.29% |
| Median Price | $1,222,500 | -2.2% |
| Sales | 12 | -7.69% |
| New Listings | 20 | +5.26% |
| Active Listings | 31 | +19.23% |
Condo townhouse prices in Markham
| Stat | August 2024 | Y/Y Change |
|---|---|---|
| Average Price | $1,229,200 | +1.52% |
| Median Price | $1,160,000 | -2.97% |
| Sales | 51 | +70% |
| New Listings | 73 | +5.8% |
| Active Listings | 133 | +82.19% |
Condo apartment prices in Markham
| Stat | August 2024 | Y/Y Change |
|---|---|---|
| Average Price | $681,151 | -0.24% |
| Median Price | $644,500 | -1.6% |
| Sales | 58 | +23.4% |
| New Listings | 151 | +27.97% |
| Active Listings | 287 | +48.7% |
Other housing market reports across the greater Toronto area:
Toronto
Halton Region
- Burlington housing market report
- Halton Hills housing market report
- Milton housing market report
- Oakville housing market report
Peel Region
York Region
- Aurora housing market report
- East Gwillimbury housing market report
- Georgina housing market report
- King housing market report
- Markham housing market report
- Newmarket housing market report
- Richmond Hill housing market report
- Vaughan housing market report
- Stouffville housing market report
Durham Region
- Ajax housing market report
- Brock housing market report
- Clarington housing market report
- Oshawa housing market report
- Pickering housing market report
- Scugog housing market report
- Uxbridge housing market report
- Whitby housing market report
Dufferin County
Simcoe County
- Adjala-Tosorontio housing market report
- Bradford housing market report
- Essa housing market report
- Innisfil housing market report
- New Tecumseth housing market report
source: TREB