Canada housing market overview
- The average home price in Canada was $649,096 — a 0.09% year-over-year increase.
- The benchmark home price in Canada was $717,400 — a -4.22% year-over-year decrease.

Table of contents
- Average Home Price Trends
- Important Market Metrics
- Historical Home Prices
- Benchmark Price by Property Type
Average home price trends
The average home price across all property types in Canada was $649,096. Home prices have increased 0.09% year-over-year compared to the average home price of $648,526 the prior year. The average home price across all property types saw a -2.7% month-over-month decreased from the average home price of $667,112 the prior month.
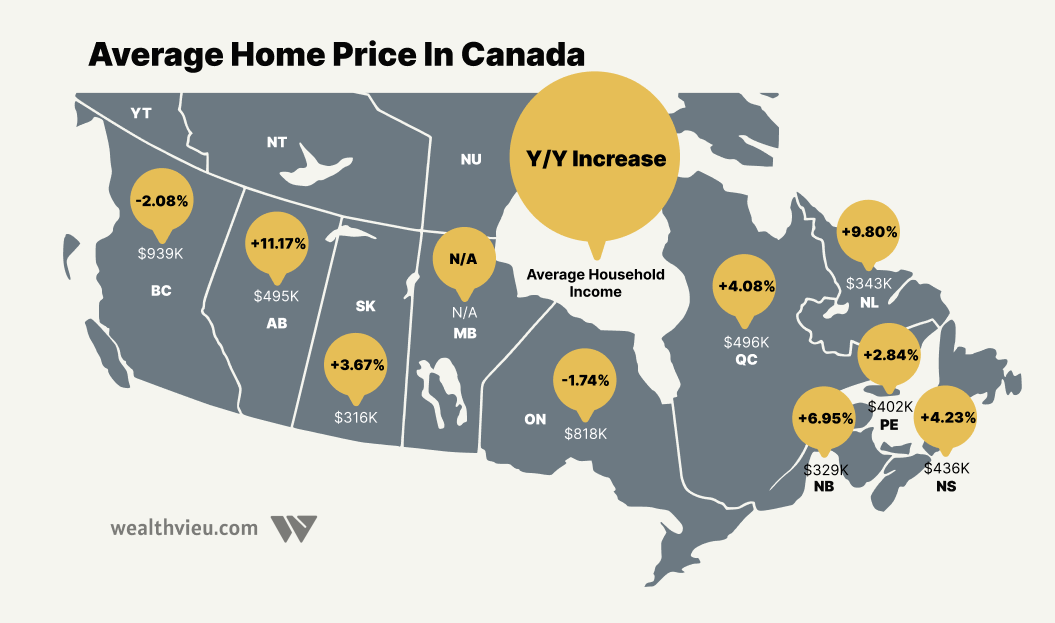
Average home price across provinces
| Province | Average | M/M | Y/Y |
|---|---|---|---|
| British Columbia | $938,500 | -2.19% | -2.08% |
| Alberta | $494,920 | +0.28% | +11.17% |
| Saskatchewan | $315,858 | -3.15% | +3.67% |
| Ontario | $817,915 | -2.36% | -1.74% |
| Quebec | $495,875 | -1.36% | +4.08% |
| New Brunswick | $329,319 | -1.94% | +6.95% |
| Nova Scotia | $435,701 | -4.11% | +4.23% |
| PEI | $401,975 | +4.41% | +2.84% |
| Newfoundland | $342,705 | +5.37% | +9.8% |
Take a look at the average home price across major cities:
Brampton Housing Market Report
Richmond Hill Housing Market Report
Waterloo Housing Market Report
Important Market Metrics
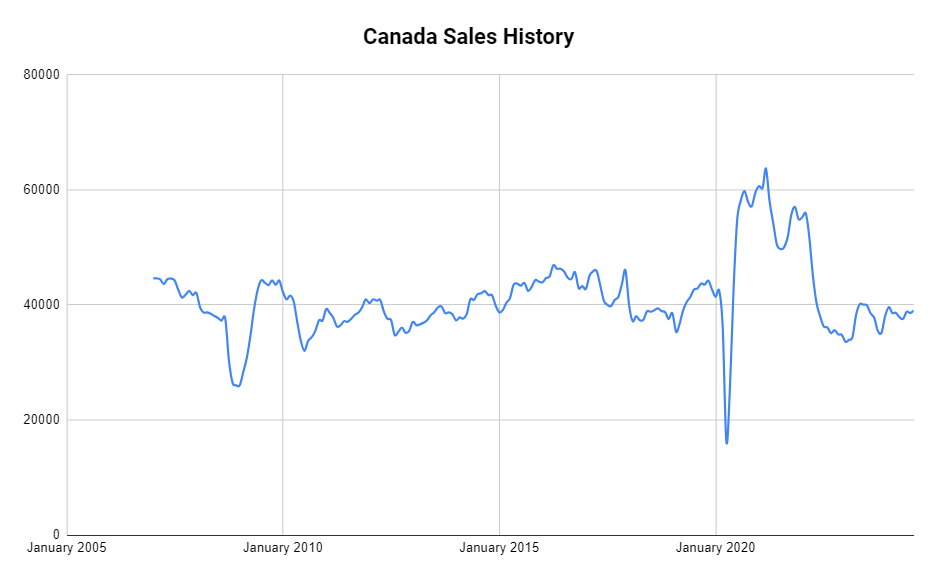
Sales

Total sales in Canada were 39073 which is a 1.39% increase from 38537 sales the prior year.
Inventory
The housing inventory this month is 4.14 months which is up from 4.17 months of inventory the prior month and 3.49 months the prior year.
Sales-to-new-Listings Ratio
The sales-to-new listing ratio is an important metric as it helps us to understand the balance of supply and demand in the housing market which helps determine who has the majority of negotiating power in the housing market. The sales-to-new-listings ratio (SNLR) in Canada was 52.98% in August 2024. The SNLR indicates a sellers market market with a SNLR ratio between 40%-60%.
Home prices in Canada

Benchmark Home prices by property types
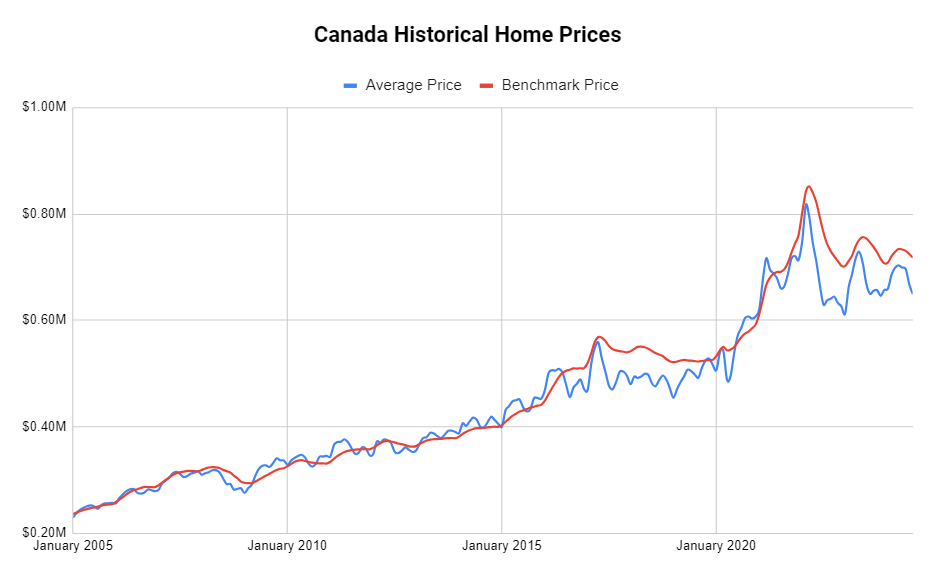
The highest historical average home price in Canada was $816,720. The highest historical benchmark home price was $852,000.
| Home Type | August 2024 | M/M | Y/Y |
|---|---|---|---|
| Benchmark Composite | $717,400 | -0.01% | -4.22% |
| Benchmark Detached | $794,000 | -0.95% | -3.55% |
| Benchmark Townhouse | $658,200 | -0.2% | -4.73% |
| Benchmark Apartment | $521,100 | +0% | -3.96% |
Benchmark home prices across provinces
| Property Type | Benchmark Price | M/M | Y/Y |
|---|---|---|---|
| British Columbia | $972,700 | -0.53% | -2% |
| Alberta | $515,700 | -0.31% | +7.42% |
| Saskatchewan | $344,700 | -0.03% | +6.13% |
| Ontario | $866,700 | -1.21% | -4.36% |
| Quebec | $487,500 | +0.49% | +4.08% |
| New Brunswick | $309,200 | +0.13% | +6.07% |
| Nova Scotia | $414,300 | -0.93% | +3.29% |
| PEI | $372,700 | +1.94% | -0.19% |
| Newfoundland | $300,700 | +1.25% | +3.73% |
Canada Housing Markets
See the housing markets in Canada broken down at a national, provincial and city level with the following reports
 Home
Home