How do current mortgage rates in the UK compare
Mortgage rates play a very important role in home affordability. The most popular mortgage terms in the UK are 5-year and 2-year terms. This means that over the lifetime of a homeowner they will be exposed to changing mortgage rates when they renew their mortgage term and lock into new rates.
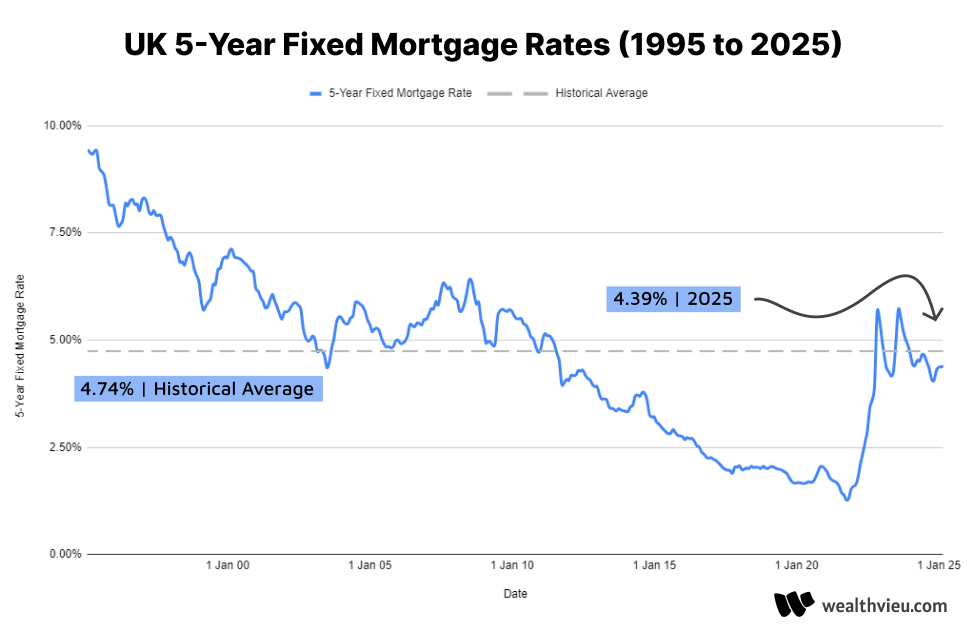
While mortgage rates in the UK may seem high at 4.39% in 2025, especially when compared to previous rates in the last 15-years, the current 5-year fixed mortgage rate is below the lifetime average. Looking at historical mortgage rates available from the Bank of England the average five year rate over the period of 1995 to 2025 is 4.74%.
UK 5-Year fixed mortgage rates from 1995 to 2025
These 5-year fixed mortgage rates are based on the monthly interest rate of UK monetary financial institutions excluding the Central Bank 5-year fixed rate mortgages to households. These rates are based on rates on mortgages with a 75% LTV or loan-to-value. In other words these rates are based on a 25% down payment.
Average Historical 5-year fixed rate by year
This is a chart summarizing the average 5-year fixed mortgage rate by year in the UK.
| Year | Rate |
|---|---|
| 2025 | 4.39% |
| 2024 | 4.4% |
| 2023 | 4.81% |
| 2022 | 3.38% |
| 2021 | 1.58% |
| 2020 | 1.8% |
| 2019 | 1.9% |
| 2018 | 2.02% |
| 2017 | 2.06% |
| 2016 | 2.5% |
| 2015 | 2.88% |
| 2014 | 3.52% |
| 2013 | 3.47% |
| 2012 | 4.13% |
| 2011 | 4.64% |
| 2010 | 5.21% |
| 2009 | 5.36% |
| 2008 | 5.88% |
| 2007 | 5.99% |
| 2006 | 5.25% |
| 2005 | 5.02% |
| 2004 | 5.6% |
| 2003 | 4.92% |
| 2002 | 5.49% |
| 2001 | 5.84% |
| 2000 | 6.79% |
| 1999 | 6.33% |
| 1998 | 6.86% |
| 1997 | 7.84% |
| 1996 | 8.04% |
| 1995 | 8.9% |