This calculator helps you find your net worth percentile in the United States as either a household or individual by age to help you compare your net worth percentile in the United States.
The data in this calculator is from the Federal Reserve SCF for the year 2023 which is the most recent data. New data for net worth percentiles will be released in 2026.
If you want to see how your individual income percentile compares to others in the U.S. you can use our income percentile calculator. For a breakdown by age, see our net worth percentile by age calculator.
Household net worth in the United States
The median household net worth in the US was $192,084 in 2023. The average net worth in 2023 was $1,059,470 which is much higher than the 2023 median net worth. This is a result of wealth being highly concentrated within the top percentiles in the United States.
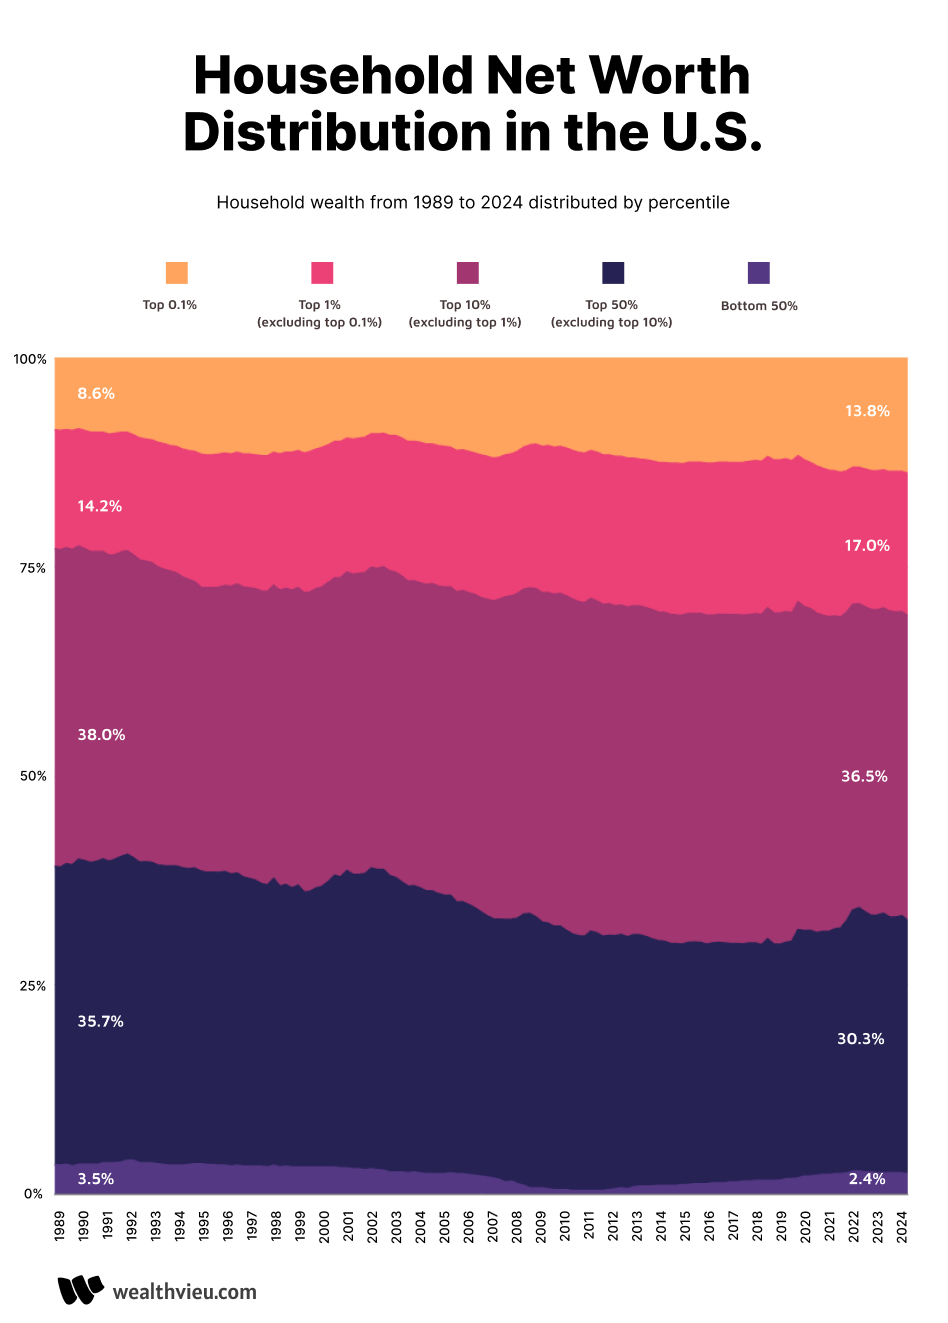
Household net worth distribution in the U.S.
This chart shows the distribution of wealth in the US by percentile. The top 0.1% of households hold 13.80% of the wealth in the United States. The top 1.0% of households in the U.S. account for 30.80% of all the wealth in the United States as of 2024.
Top 1% household net worth in the US
To be considered in the 99th percentile or top 1% of household net worth in the US you need at least $13,666,778 in 2023. This is a significant amount of net worth which helps explain the variation between the median and average net worth in the United States. Those in the top 1% of net worth skew the average net worth figure to over $1 million dollars.
Top 10% household net worth
The 90th percentile or to be considered in the top 10% of households for net worth the threshold is $1,920,758.
Individual net worth by age in the United States
The net worth of an individual is highly correlated to age. For this reason it is important to compare your net worth against that of other people in the same age bracket as you. For example the median net worth of an individual between the ages of 18-24 is $10,222, which is the lowest of all age brackets for many reasons including this age bracket includes students with debt and individuals fresh to the workforce. Compare this to an age bracket of 35-39 which has a median net worth of $138,588.
Average net worth by age
These are the average net worth of individuals in the United States broken down by age category for 2023.
- 18-24: $112,104
- 25-29: $120,183
- 30-34: $258,075
- 35-39: $501,295
- 40-44: $590,710
- 45-49: $781,936
- 50-54: $1,132,497
- 55-59: $1,441,987
- 60-64: $1,675,294
- 65-69: $1,836,884
- 70-74: $1,714,085
- 75-79: $1,629,275
- 80+: $1,611,984
Median net worth by age
These are the median net worth of individuals by age group for 2023 in the United States:
- 18-24: $10,222
- 25-29: $31,470
- 30-34: $88,631
- 35-39: $138,588
- 40-44: $134,382
- 45-49: $213,586
- 50-54: $266,140
- 55-59: $321,074
- 60-64: $392,860
- 65-69: $393,480
- 70-74: $438,700
- 75-79: $338,180
- 80+: $327,200
Net worth percentile by age
Net worth varies dramatically by age as wealth accumulates over a lifetime of earning, saving, and investing. Younger age groups typically have lower net worth due to student debt, lower incomes, and less time for investments to compound. Peak net worth is typically reached between ages 65 and 74 as retirement savings, home equity, and investment portfolios reach their highest values.
For a detailed breakdown of net worth percentiles across all age groups, use our net worth percentile by age calculator which provides data for the 25th, 50th, 75th, 90th, and 99th percentiles for each age bracket.
Source: Federal Reserve Survey of Consumer Finances (SCF) 2023