Average Income In Canada
The average income in Canada is $57,100 and the median income is $43,100. This income includes employment income, investment income, retirement income and other income.
This table shows the average income in Canada over the past 10 year inflation adjusted to the most recent year’s average and median income. The average income in Canada has increased from $51,400 in 2012 where it reached a peak of $57,700 in 2021. The average income then decreased as a result of inflation to its current average of $57,100.
| Year | Average Income | Median Income |
|---|---|---|
| 2012 | $51,400 | $38,300 |
| 2013 | $52,300 | $39,200 |
| 2014 | $52,800 | $39,800 |
| 2015 | $53,100 | $39,500 |
| 2016 | $52,700 | $39,700 |
| 2017 | $54,200 | $40,600 |
| 2018 | $54,200 | $41,000 |
| 2019 | $54,300 | $41,800 |
| 2020 | $56,700 | $43,600 |
| 2021 | $57,700 | $44,000 |
| 2022 | $57,100 | $43,100 |
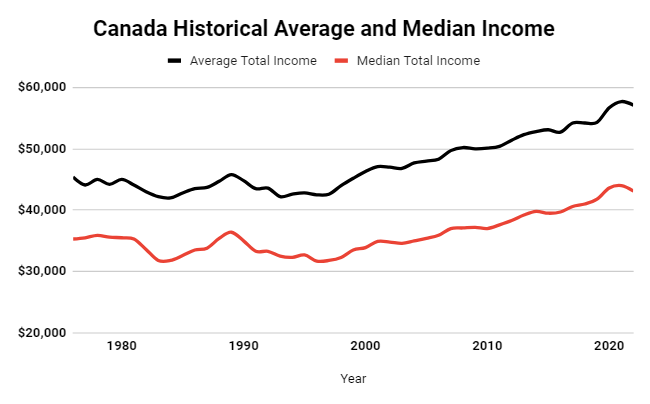
Average Historical Income in Canada
This graph shows the historical average income in Canada adjusted for inflation.
Average Income in Canada by Age
When trying to see how your income compares to that of others, comparing by age is a good metric. The average and median income in Canada is broken down by five different age groups. While these age groups span 10+ years which can still make it difficult to directly compare, it is still a better comparison than using the overall average income in Canada.
| Age Group | Average Income | Median Income |
|---|---|---|
| 35 to 34 | $55,000 | $48,100 |
| 35 to 44 | $72,800 | $60,300 |
| 45 to 54 | $77,400 | $60,400 |
| 55 to 64 | $64,300 | $48,900 |
| 65+ | $48,600 | $34,600 |
If you want to compare exactly where you stand in your age group, check out this Canada income percentile calculator to see which income percentile you fall into.
Average Salary in Canada
You may be wondering how your salary compares to others in Canada? The average salary in Canada is $55,300 and the median salary is $42,400. This is much lower than the average income in Canada which includes sources of income such as investment income, retirement income and other income.
This table breaks down the average and median salary in Canada over the past 10-years when adjusted for inflation.
| Year | Average Income | Median Income |
|---|---|---|
| 2012 | $51,100 | $38,600 |
| 2013 | $52,200 | $39,200 |
| 2014 | $52,500 | $39,700 |
| 2015 | $52,800 | $39,700 |
| 2016 | $52,300 | $39,300 |
| 2017 | $52,900 | $39,600 |
| 2018 | $53,200 | $40,300 |
| 2019 | $52,500 | $41,000 |
| 2020 | $52,400 | $39,800 |
| 2021 | $55,100 | $42,200 |
| 2022 | $55,300 | $42,400 |
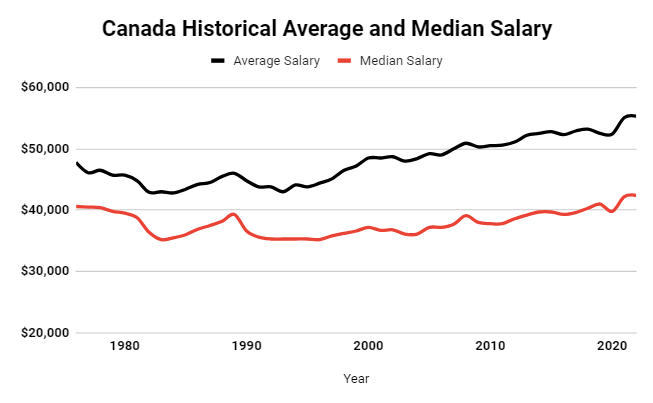
Average Historical Salary in Canada
This graph shows the historical average salary in Canada adjusted for inflation.
Average income in other provinces and territories
Compare the income to Canada's average and median income or other provinces: